
Distance-time and velocity-time graphs show how an object moves, and two simple tools unlock almost every question on them: the gradient and the area. This guide covers what each motion graph shows, the common mistakes, and three fully worked examples.
Key takeaways
- The gradient of a distance-time graph is speed. The gradient of a displacement-time graph is velocity.
- The gradient of a velocity-time graph is acceleration.
- The area under a velocity-time graph is displacement (or distance travelled).
- A curved line means the gradient is changing. Draw a tangent to find the gradient at one moment.
- Always read both axes and their units before you calculate anything.
What do distance-time and velocity-time graphs show?
Quick answer: A distance-time graph shows how far an object has gone at each moment, so its gradient gives speed. A velocity-time graph shows how fast it is going, and in which direction, at each moment. Its gradient gives acceleration, and the area under its line gives displacement. Time always goes on the horizontal axis.
The two graphs can look the same but mean different things, so always check the vertical axis first. A displacement-time graph tracks position from a start point, so it can go down when the object moves back. At A-level and in AP Physics 1 you will also meet the acceleration-time graph.
What does the gradient of each motion graph mean?
The gradient is "rise over run": change on the vertical axis ÷ change on the horizontal axis. Time is on the horizontal axis, so the gradient is always a rate.
- Distance-time graph: gradient = speed, in m/s.
- Displacement-time graph: gradient = velocity, in m/s. A negative gradient means moving backwards.
- Velocity-time graph: gradient = acceleration, in m/s^2. A negative gradient means slowing down (if velocity is positive).
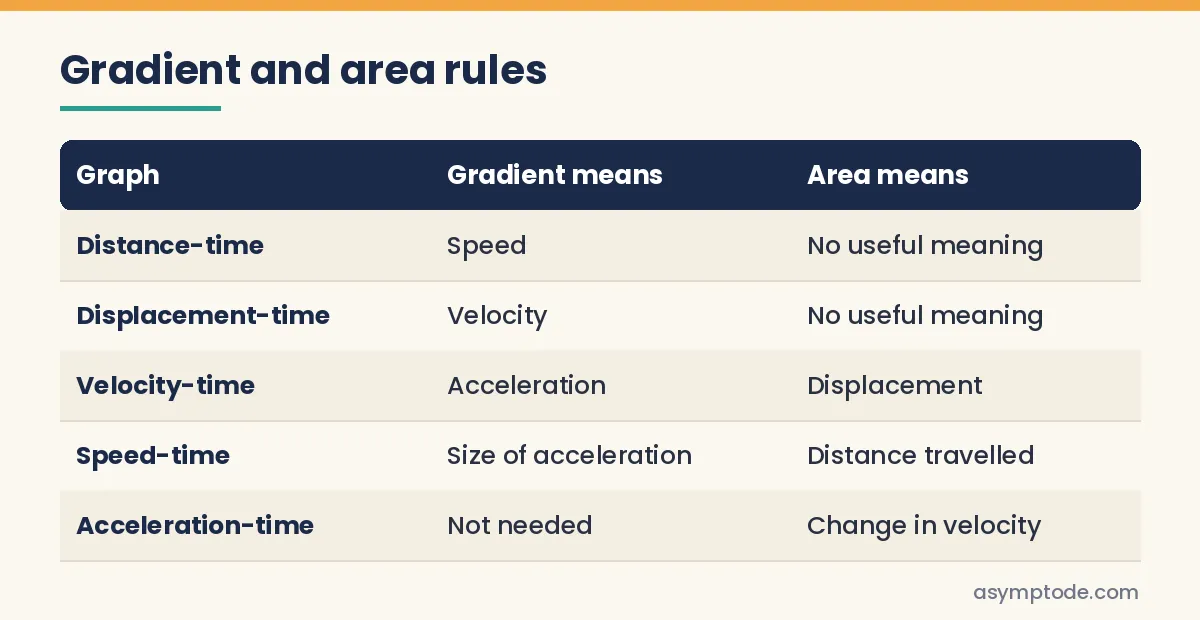 The gradient and area rules for every motion graph you will meet.
For distance-time graphs, the gradient is speed and the area has no useful meaning. For displacement-time graphs, the gradient is velocity. For velocity-time graphs, the gradient is acceleration and the area is displacement. For speed-time graphs, the gradient is the size of the acceleration and the area is distance travelled. For acceleration-time graphs, the area is change in velocity; you do not need the gradient.
What does the area under a velocity-time graph mean?
The area between the line and the time axis equals displacement, because velocity × time = displacement. Split the shape into rectangles and triangles, find each area, then add them.
Area above the time axis is positive (moving forwards). Area below is negative (moving backwards). For total distance, add the sizes and ignore the signs.
On an acceleration-time graph, the area under the line gives the change in velocity. This appears in AQA A-level and AP Physics 1.
How do you read the shape of a line on a motion graph?
Many questions say "describe the motion". Match the shape to its meaning.
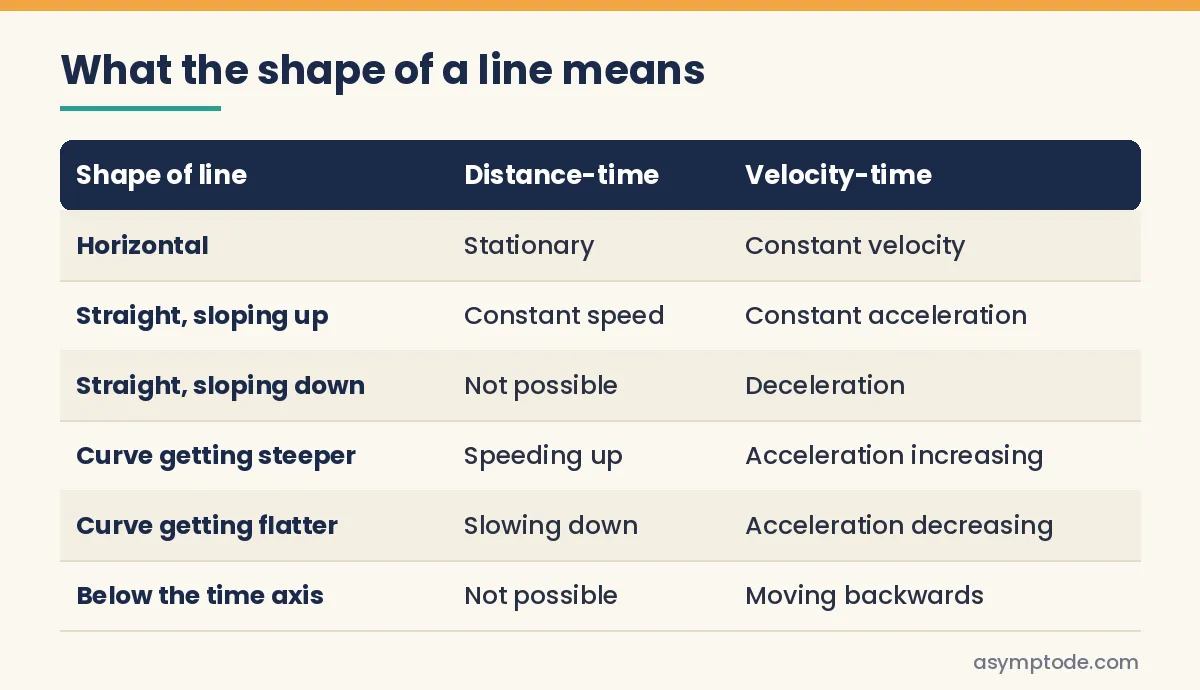 The same shape means different motion on each graph.
A horizontal line means stationary on a distance-time graph but constant velocity on a velocity-time graph. A straight line sloping up means constant speed on a distance-time graph but constant acceleration on a velocity-time graph. A line sloping down is not possible on a distance-time graph, because distance never decreases; on a velocity-time graph it means deceleration. A curve getting steeper means speeding up (distance-time) or acceleration increasing (velocity-time). A curve getting flatter means slowing down or acceleration decreasing. A line below the time axis is not possible for distance, but on a velocity-time graph it means moving backwards.
What does a curved line on a motion graph mean?
A curve means the gradient is changing. On a distance-time graph, a curve that gets steeper means the object is speeding up.
To find the speed at one moment, draw a tangent: a straight line that just touches the curve there. Then find its gradient. The AQA GCSE specification includes this tangent method for Higher Tier students. AP Physics 1 states the same idea: instantaneous velocity is the slope of a tangent on a position-time graph.
For the area under a curved velocity-time graph, count squares. Find what one square is worth (for example, 1 m/s × 1 s = 1 m), count them, and multiply.
Worked examples: distance-time and velocity-time graphs
Example 1: speed from a distance-time graph
A cyclist's distance-time graph is a straight line from (0 s, 0 m) to (40 s, 120 m). Then it is flat until 60 s.
- Gradient of the first part = 120 m ÷ 40 s = 3 m/s.
- The flat part has a gradient of 0, so the cyclist is stationary.
- Average speed for the whole trip = total distance ÷ total time = 120 m ÷ 60 s = 2 m/s.
The average speed is lower than the moving speed because the stop is included.
Example 2: area under a velocity-time graph
A car speeds up evenly from rest to 12 m/s in 6 s. It stays at 12 m/s for 10 s. Then it slows evenly to rest in 4 s.
 Split the shape, find each area, then add.
The animation shows the gradient 12 ÷ 6 = 2 m/s^2, then the three areas: 36 m, 120 m and 24 m, which add to 180 m.
- Acceleration = gradient = 12 ÷ 6 = 2 m/s^2.
- Deceleration = 12 ÷ 4 = 3 m/s^2, so acceleration = -3 m/s^2.
- Area 1 (triangle) = 0.5 × 6 s × 12 m/s = 36 m.
- Area 2 (rectangle) = 10 s × 12 m/s = 120 m.
- Area 3 (triangle) = 0.5 × 4 s × 12 m/s = 24 m.
- Total distance = 36 + 120 + 24 = 180 m. Average speed = 180 m ÷ 20 s = 9 m/s.
Example 3: displacement vs distance
A ball is thrown straight up at 20 m/s. To keep the numbers simple, take g as 10 m/s^2. Its velocity-time graph is a straight line from +20 m/s at 0 s to -20 m/s at 4 s, crossing zero at 2 s.
- Gradient = (-20 - 20) ÷ 4 = -10 m/s^2. This is the acceleration due to gravity, pointing down.
- Area from 0 to 2 s (above the axis) = 0.5 × 2 × 20 = +20 m. The ball rises 20 m.
- Area from 2 to 4 s (below the axis) = -20 m. The ball falls 20 m.
- Displacement = 20 + (-20) = 0 m. The ball is back where it started.
- Distance travelled = 20 + 20 = 40 m.
For more on motion under gravity, see our guide to projectile motion.
Want a mentor to check your graph working line by line? Book a free demo class with Asymptode, or see our plans and fees.
How do you read any motion graph, step by step?
 Four checks that work on every motion graph.
First, read both axes and their units. Second, use the gradient (rise over run) to find a rate. Third, use the area between the line and the time axis. Fourth, check the sign, the units and the direction.
What are the most common mistakes with motion graphs?
- Reading the wrong axis. A flat line on a velocity-time graph means steady velocity, not "stopped".
- Mixing up distance and displacement. Distance and speed are scalars. Displacement and velocity are vectors, so they have a direction. AQA GCSE asks you to explain this difference.
- Forgetting units. Convert minutes to seconds first. Acceleration is m/s^2, not m/s.
- Dividing one point's values. The gradient uses changes between two points, unless the line starts at the origin.
- Ignoring negative area. Area below the time axis is negative displacement.
See Newton's three laws for how acceleration links to force. The work-energy theorem uses the same "area under a graph" idea with force and displacement.
Where are motion graphs in the syllabus?
- AQA GCSE Physics 8463. The AQA forces subject content covers the distance-time relationship and acceleration. Finding speed with a tangent and finding distance from the area under a velocity-time graph are Higher Tier only. See our GCSE Physics guide.
- AQA A-level Physics 7408. The mechanics and materials content asks for the meaning of areas and gradients for uniform and non-uniform acceleration, using a bouncing ball as an example. See our A-level Physics guide.
- AP Physics 1. Unit 1 Kinematics is 10%–15% of the multiple-choice section, per the AP Physics 1 course page. The Course and Exam Description says students are not expected to do calculations with non-uniform acceleration, but must sketch and discuss it. See our AP Physics 1 exam guide.
- JEE Main. The JEE Main 2027 syllabus, linked from jeemain.nta.nic.in, lists velocity-time and position-time graphs under Kinematics. See our JEE Main 2027 guide.
How 1-on-1 tutoring helps with motion graphs
- One dedicated mentor, live online 1-on-1. Your Asymptode mentor follows your own syllabus, whether that is AQA, AP or JEE Main, and works around your exam dates.
- Method-first. The mentor watches each step of your working and spots exactly where a sign or unit goes wrong.
- Personalised homework with feedback. Graph questions matched to your gaps, such as tangents or negative areas.
- Every class recorded, with short parent updates. Rewatch any explanation before a test. Parents get brief progress notes. Start with a free demo class.
Facts checked against official sources on 7 November 2026.
FAQ
What is the difference between a distance-time and a velocity-time graph?
A distance-time graph shows how far an object has travelled; its gradient is speed. A velocity-time graph shows velocity; its gradient is acceleration and its area is displacement.
What does the gradient of a velocity-time graph show?
It shows acceleration, in m/s^2. A positive gradient means velocity is increasing. A negative gradient means it is decreasing, and a zero gradient means constant velocity.
What does the area under a velocity-time graph represent?
It represents displacement. Area above the time axis is positive and area below is negative. For total distance travelled, add the sizes of all the areas.
How do you find speed from a curved distance-time graph?
Draw a tangent that touches the curve at the time you want. Then find the gradient of the tangent using two points far apart on it. That gradient is the speed at that moment.
Can a distance-time graph slope downwards?
No. Distance travelled can only stay the same or increase. A displacement-time graph can slope down, which means the object is moving back towards its start.
What does the area under an acceleration-time graph show?
It shows the change in velocity, in m/s. This is in AQA A-level Physics and AP Physics 1.
Ready to start? Book a free demo class and advisor call, or see our plans and fees.