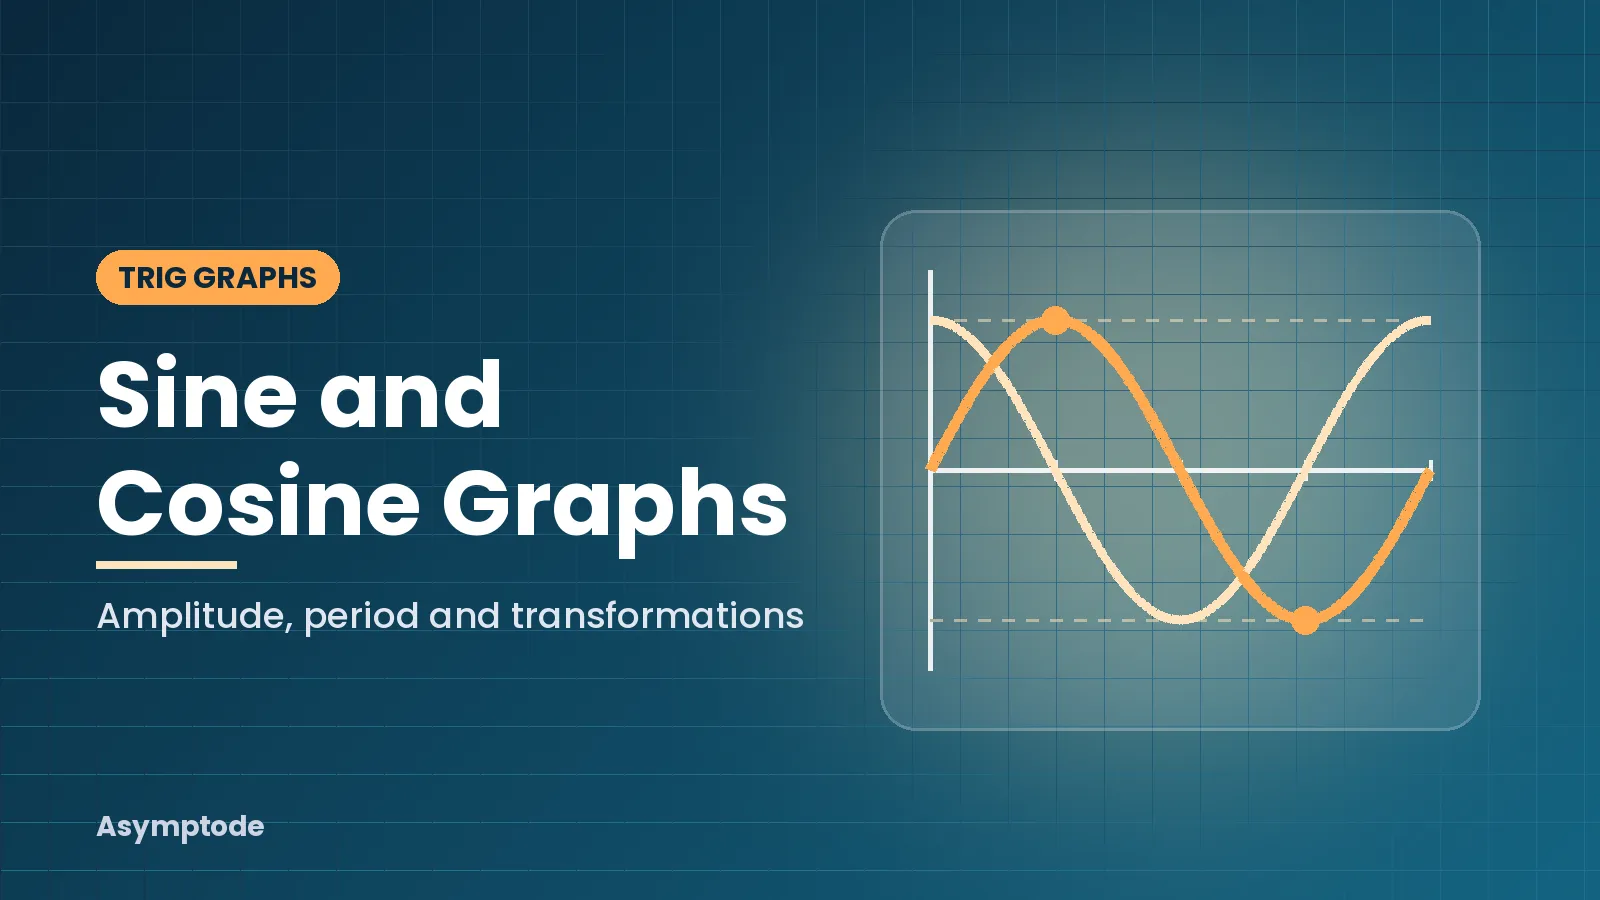
The graphs of sine and cosine are smooth waves that repeat every 360° (or 2π radians), and five key points are enough to sketch either one. This guide covers key points, amplitude, period, solving equations from the graph, and transformations.
Key takeaways
- y = sin x starts at 0, rises to 1 at 90°, and is back to 0 at 180° and 360°.
- y = cos x starts at 1, falls to -1 at 180°, and is back to 1 at 360°.
- Both graphs have amplitude 1 and period 360° (2π radians). Both stay between -1 and 1.
- The cosine graph is the sine graph moved 90° to the left: cos x = sin(x + 90°).
- In y = a sin(bx) + c, a sets the amplitude, b changes the period to 360° ÷ b, and c moves the wave up or down.
What do the graphs of sine and cosine look like?
Quick answer: Both graphs are repeating waves. The sine wave starts at the origin, peaks at (90°, 1), crosses the axis at 180°, drops to (270°, -1) and returns to zero at 360°. The cosine wave has the same shape but starts at its peak, (0°, 1). Each repeats every 360°, or 2π radians.
New to sin and cos? Start with trigonometry ratios explained. The graphs extend those right-angled triangle ratios to every angle.
What are the key points of y = sin x and y = cos x?
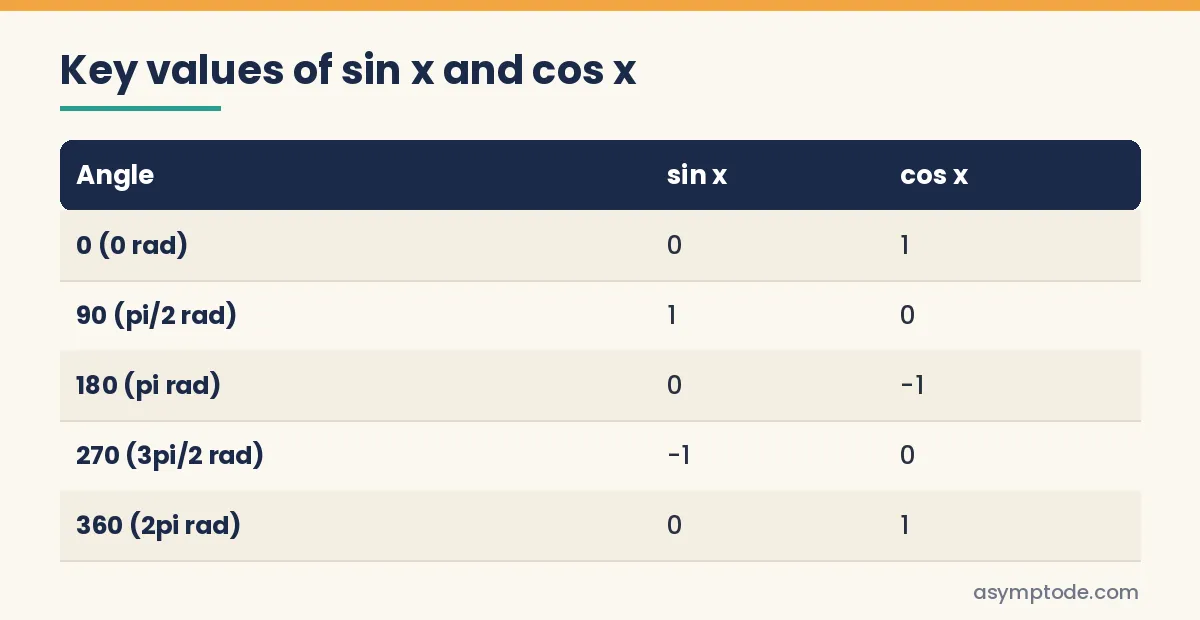 Five key points are enough to sketch one full wave of each graph.
The table shows sin x and cos x at 0°, 90°, 180°, 270° and 360° (0, π/2, π, 3π/2 and 2π radians). Sine goes 0, 1, 0, -1, 0. Cosine goes 1, 0, -1, 0, 1.
| Angle (degrees) | Angle (radians) | sin x | cos x |
|---|---|---|---|
| 0° | 0 | 0 | 1 |
| 90° | π/2 | 1 | 0 |
| 180° | π | 0 | -1 |
| 270° | 3π/2 | -1 | 0 |
| 360° | 2π | 0 | 1 |
Plot these points and join them with a smooth, rounded curve, not straight lines.
What are the amplitude and period of sin x and cos x?
- Amplitude is the height from the middle line to the top. For y = sin x and y = cos x the amplitude is 1.
- Period is the width of one full wave before it repeats. For both graphs it is 360°, or 2π radians.
- Maximum value is 1. Sine reaches it at 90°. Cosine reaches it at 0° and 360°.
- Minimum value is -1. Sine reaches it at 270°. Cosine reaches it at 180°.
- Range: both graphs stay between -1 and 1. So sin x = 2 has no solution.
The pattern repeats forever, so sin 450° = sin 90° = 1.
What symmetry do the sine and cosine graphs have?
- The cosine graph is symmetrical about the y-axis. So cos(-x) = cos x.
- The sine graph has rotational symmetry about the origin. So sin(-x) = -sin x.
- Between 0° and 180°, the sine graph is symmetrical about the line x = 90°. This gives the rule sin(180° - x) = sin x. You will use this rule to solve equations.
How are the sine and cosine graphs related?
The cosine graph is the sine graph shifted 90° to the left. In symbols, cos x = sin(x + 90°). Check it at x = 0°: sin 90° = 1, and cos 0° = 1. In radians, cos x = sin(x + π/2).
How do you solve sin x = 0.5 using the graph?
 The line y = 0.5 crosses the sine wave twice between 0° and 360°.
The animation draws y = sin x and the line y = 0.5, which cross twice: at 30° (from the calculator) and at 180° - 30° = 150° (from symmetry).
- Sketch y = sin x for 0° to 360°.
- Draw the horizontal line y = 0.5.
- Count the crossing points. There are two.
- Use your calculator in degree mode: sin⁻¹(0.5) = 30°.
- Use the symmetry about x = 90°: 180° - 30° = 150°.
- Answer: x = 30° or x = 150°. In radians: x = π/6 or 5π/6.
Check: sin 150° = 0.5. Cambridge IGCSE 0580 asks students to solve equations like this for 0° ≤ x ≤ 360° (see the 0580 syllabus, section E6.4).
How do transformations change the graph of y = sin x?
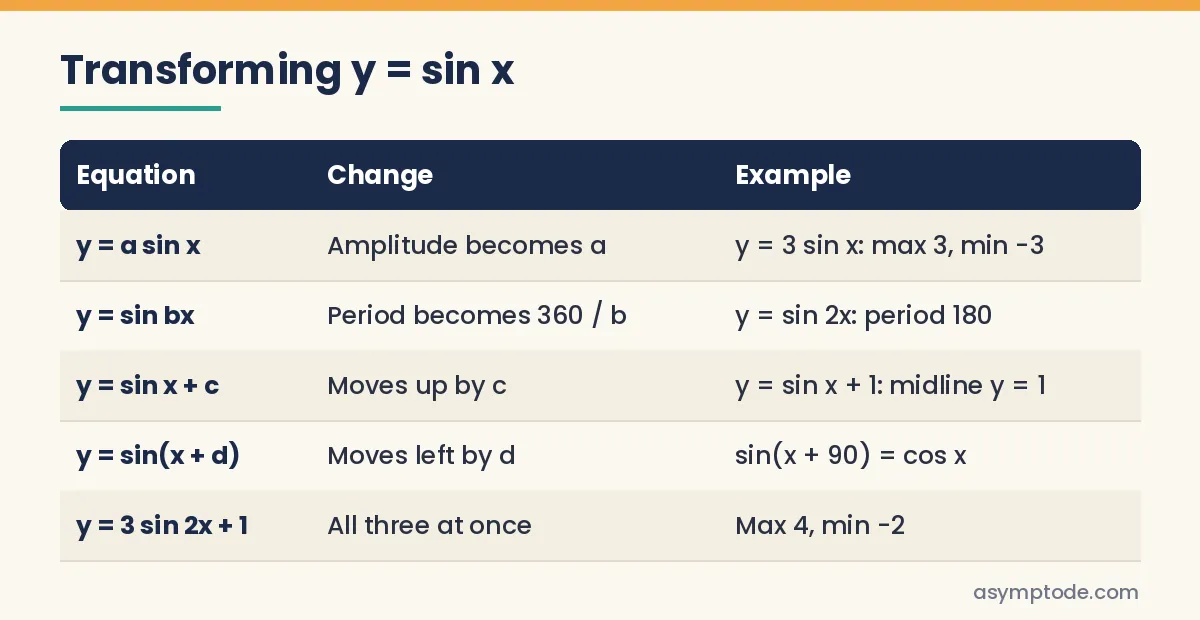 Each letter in y = a sin(bx) + c changes one feature of the wave.
The table lists each transformation, what it changes, and an example:
| Equation | What changes | Example |
|---|---|---|
| y = a sin x | Amplitude becomes a | y = 3 sin x: max 3, min -3 |
| y = sin bx | Period becomes 360° ÷ b | y = sin 2x: period 180° |
| y = sin x + c | Wave moves up by c | y = sin x + 1: midline y = 1 |
| y = sin(x + d) | Wave moves left by d | sin(x + 90°) = cos x |
| y = 3 sin 2x + 1 | All three at once | max 4, min -2 |
The same rules work for cosine. A minus sign in front, y = -sin x, reflects the wave in the x-axis. In y = sin(x - 30°), the wave moves 30° to the right, not left.
Worked example: y = 3 sin 2x + 1
- Amplitude: a = 3, so the wave goes 3 above and 3 below its middle line.
- Period: b = 2, so the period is 360° ÷ 2 = 180°. You get two full waves between 0° and 360°.
- Midline: c = 1, so the middle line is y = 1.
- Maximum: 1 + 3 = 4. It happens at x = 45° and x = 225°.
- Minimum: 1 - 3 = -2. It happens at x = 135° and x = 315°.
Cambridge IGCSE Additional Mathematics 0606 uses this exact function as its example of amplitude and period (see the 0606 syllabus, sections 10.2 and 10.3).
How do you sketch a sine or cosine graph step by step?
 Find the numbers first, then draw the wave.
The animation builds the sketch in these six steps:
- Find the amplitude and the midline.
- Find the period: 360° ÷ b (or 2π ÷ b in radians).
- Split one period into four equal parts.
- Plot the maximum, minimum and midline points.
- Join them with a smooth wave, not sharp V shapes.
- Label the axes, the scale and the key points.
What are the most common mistakes with trig graphs?
- Wrong calculator mode. In degree mode, sin 30 = 0.5. In radian mode, sin 30 ≈ -0.988, because it reads 30 as radians. Check the mode before every trig question.
- Giving only one solution. Your calculator gives one answer. The graph usually has two in 0° to 360°. Always sketch and look.
- Wrong direction for a shift. y = sin(x + 90°) moves left, not right.
- Wrong period. y = sin 2x has period 180°, not 720°.
Where do graphs of sine and cosine appear in the syllabus?
| Course | What the official document says |
|---|---|
| AQA GCSE Maths 8300 (Higher) | Recognise, sketch and interpret y = sin x, y = cos x and y = tan x, in degrees, for angles of any size (A12). Sketch translations and reflections (A13). |
| Cambridge IGCSE Maths 0580 (Extended) | Sketch and interpret the graphs for 0° ≤ x ≤ 360°. Solve trig equations in that range (E6.4). |
| Cambridge IGCSE Additional Maths 0606 | Amplitude and period. Draw y = a sin bx + c and y = a cos bx + c (10.2, 10.3). |
| AQA A-level Maths 7357 | Sine, cosine and tangent graphs, symmetries and periodicity, with exact values in radians (E3). Transformations (B9). |
| AP Precalculus (CED, effective Fall 2026) | Unit 3, Trigonometric and Polar Functions: topics 3.4 to 3.6 cover sine and cosine graphs and sinusoidal transformations. |
Sources: AQA 8300 specification, AQA 7357 specification and the AP Precalculus Course and Exam Description. In the AP CED, Unit 3 makes up 30-35% of the multiple-choice section. For exam structure, see our guides to GCSE maths papers, IGCSE Maths 0580, A-level Maths and the AP Precalculus exam.
For IB students (see IB Maths AA vs AI) and Indian Class 11 students, check your official IB guide, or the NCERT textbook and NTA pages, for the exact wording.
Stuck on a sketch or a missing second solution? Book a free demo class with a maths mentor, or see our plans and fees.
How Asymptode helps you with graphs of sine and cosine
At Asymptode, a qualified maths mentor teaches your child one-to-one, live online. Lessons follow the exact trig graph content in your child's course, whether that is AQA GCSE Higher, Cambridge IGCSE 0580 or 0606, AQA A-level or AP Precalculus Unit 3. Lessons fit around their real school and exam dates. The mentor secures the key points, amplitude and period first, then transformations and solving equations.
Between classes, your child gets practice built for them. Our AI helps make a worksheet from what their last attempt showed they had not understood. That might be a missed second solution or a shift drawn the wrong way. It is set at their level, never generic. It is written to the mentor's brief and sent only after the mentor approves it.
The mentor marks the work. You see what your child understood and what to practise next, so each week's practice keeps steering toward confident, accurate trig graphs. Book a free demo class or see our fees.
Facts checked against official sources on 11 November 2026.
FAQ
What is the period of y = sin x and y = cos x?
The period of both graphs is 360°, or 2π radians. This means the wave repeats itself every 360°. For y = sin bx or y = cos bx, the period becomes 360° ÷ b.
What is the difference between the sine and cosine graphs?
They have the same shape, amplitude and period. The sine graph starts at 0 when x = 0°, while the cosine graph starts at 1. The cosine graph is the sine graph moved 90° to the left, so cos x = sin(x + 90°).
Why does sin x = 0.5 have two answers between 0° and 360°?
The line y = 0.5 crosses the sine wave twice in that range. The answers are 30° and 150°, because sin(180° - x) = sin x. Your calculator only gives 30°, so use the graph to find the second answer.
How do you find the amplitude of a sine graph?
In y = a sin x, the amplitude is a (take the positive value if a is negative). You can also take (maximum - minimum) ÷ 2. For y = 3 sin 2x + 1, that is (4 - (-2)) ÷ 2 = 3.
Do I need radians for trig graphs?
At GCSE and IGCSE 0580, graphs use degrees. AQA A-level Maths and AP Precalculus also use radians. Learn both scales: 90° = π/2, 180° = π and 360° = 2π.
Can sin x or cos x be bigger than 1?
No. Both functions always stay between -1 and 1. So an equation like sin x = 2 has no solutions. If you get a value outside this range, check your working.
Ready to start? Book a free demo class and advisor call, or see our plans and fees.